Bitcoin erased last week's losses as it now challenges a key resistance
Bitcoin got under some selling pressure last week that culminated in a quick selloff on Thursday. The catalyst for the selloff was the spat between Musk and Trump that affected also other risk assets like stocks. The underlying reason was probably the threat of blocking the Trump's tax bill in some way which would have weighed on growth expectations.
Tensions eventually eased and things got better, although it's very unlikely to see them get back together. Nevertheless, as tensions eased, bitcoin and stocks started to recoup the losses and experienced a V-shaped recovery. There are mainly three risks for the cryptocurrency ahead: the failure of Trump's tax bill, renewed trade war after the July's deadline or increased inflation fears that trigger a hawkish repricing in interest rates expectations.
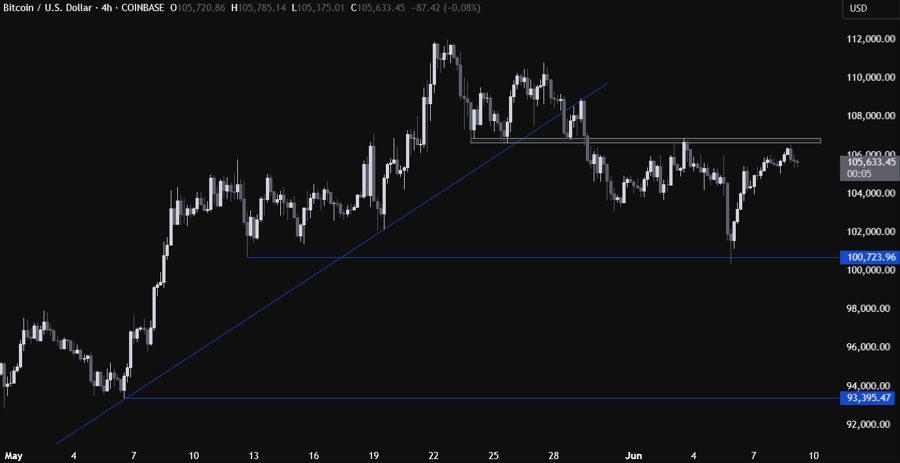
On the 4 hour chart, we can see the selloff into the 100,723 swing level and then the V-shaped recovery as the dip-buyers piled in and increased the bullish bets as tensions eased. The price is now trading just beneath the key resistance zone around the 106,800 level.
This is where we can expect the sellers to step in with a defined risk above the resistance to position for a drop back into the 100,723 level. The buyers, on the other hand, will look for a break higher to increase the bullish bets into a new all-time high.
 Copy Link
 Share on Facebook
 Share on X
 Share by Email