Gold Technical Analysis – Are we done with the repricing?
Fundamental Overview
Gold has been under pressure for a few weeks as the market priced out the stagflationary expectations and repriced the rate cut bets. The market is now seeing around 58 bps of easing for the Fed by year-end compared to like 120 bps at the peak of the fears in April.
In the bigger picture, gold remains in an uptrend as real yields will likely continue to fall amid Fed easing. But in the short-term the repricing in rate cuts expectations could weigh on gold, so watch out for the economic data and Fed comments.
Gold Technical Analysis – Daily Timeframe

On the daily chart, we can see that gold eventually pulled all the way back to the major trendline where the buyers stepped in with a defined risk below the trendline to position for a rally into a new all-time high. The sellers will need to see the price breaking lower to start targeting the 2960 level next.
Gold Technical Analysis – 4 hour Timeframe
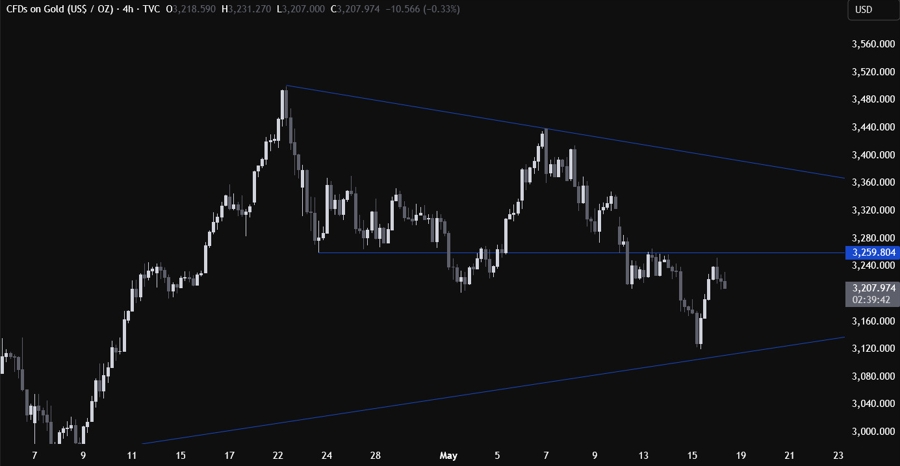
On the 4 hour chart, we can see that we had quite strong bounce around the trendline as the buyers kept pushing into the key 3260 level. The sellers stepped in around the resistance to position for a drop back into the trendline, while the buyers will need to see the price breaking above the 3260 level to extend the rally into the downward trendline around the 3360 level.
Gold Technical Analysis – 1 hour Timeframe

On the 1 hour chart, we can see that we have a minor support zone around the 3200 level. This is where we can expect the buyers to step in with a defined risk below the support to position for a break above the 3260 level. The sellers, on the other hand, will look for a break lower to increase the bearish bets into the lows. The red lines define the average daily range for today.
Upcoming Catalysts
Today, we conclude the week with the University of Michigan Consumer Sentiment report.
 Copy Link
 Share on Facebook
 Share on X
 Share by Email