US Dollar down while markets brace from Trump bill vote
- The US Dollar Index stuck in a third consecutive day of losses, weekly loss exceeds 1%.
- Israel’s reported plans to target Iranian nuclear facilities raise doubts among traders about Trump’s ability to handle tensions in the Middle East.
- The US Dollar Index sinks below 100.00 and heads towards 99.50, testing further downside.
The US Dollar Index (DXY), which tracks the performance of the US Dollar (USD) against six major currencies, is facing around 1.3% losses in just three trading days on Wednesday, trading near 99.58.. Throughout the week, the USD has already paid the price for the volatile policy swings from the Trump administration, which is facing difficulties on several fronts.
US President Trump apparently no longer has firm control over Israel’s Prime Minister Benjamin Netanyahu. In his tour of the Middle East, Trump announced it was time for a new nuclear deal with Iran and a second chance. However, in late trading hours on Tuesday, CNN reported that Israel considers striking nuclear installations in Iran – something that former President Joe Biden was able to avoid –, and undoes President Trump’s diplomatic efforts from the past few days in the region.
The second front is domestic, with another failure for what Trump calls the “Big Beautiful Bill”. Trump got frustrated with demands to significantly boost the cap on the state and local tax (SALT) deduction, signaling a deadlock in passing a giant tax-cut bill. Trump told lawmakers not to let the SALT deduction or differences over social safety-net cuts impede the bill, but lawmakers from high-tax states and conservative hardliners are still opposed to the bill unless their changes are made, Bloomberg reports.
Daily digest market movers: Time to vote
- Republican representative Chip Roy says that still will vote against Trump's tax bill. This despite efforts from the Speaker of the House of Representatives, Mike Johnson, offering a $40,000 SALT deduction cap agreement. Johnson meanwhile confirmed that the tax bill will be heading towards the floor for a vote, Bloomberg reports
- The weekly Mortgage Applications fell by -5.1% against the previous number at a 1.1% increase the week before.
- Around 16:15 GMT, Federal Reserve Bank (Fed) of Richmond President Thomas Barkin will hold a speech with possible market comments. Fed’s Barkin already spoke earlier this week, saying that it will take several months, even into the summer, before the economic situation and US data stabilizes.. Fed Governor Michelle Bowman will also participate in the event.
- No luck for European or US equities which remain sub zero this Wednesday. US equities are flirting with losses between 0.50% to 1.00% losses.
- The CME FedWatch tool shows the chance of an interest rate cut by the Federal Reserve in June’s meeting at just 5.4%. Further ahead, the July 30 decision sees odds for rates being lower than current levels at 26.9%. Recent hawkish comments from Fed officials have reduced the chances of a rate cut in the short term.
- The US 10-year yields trade around 4.53%, cooling down from the steep rally seen on Monday.
US Dollar Index Technical Analysis: Make or break
The US Dollar Index is cracking under pressure and is starting to look very bleak. In early Wednesday trading, the DXY extended losses below the 100.00 threshold after closing below the substantial floor at 100.22 the previous day, which could lead the index to make a nosedive move. With the recent geopolitical headlines, traders are coming more and more to the conclusion that President Trump might face several substantial setbacks in his term and policy implementation.
On the upside, the broken ascending trend line and the 100.22 level, which held the DXY back in September-October, are the first resistance zone. Further up, 101.90 is the next big resistance again as it already acted as a pivotal level throughout December 2023 and as a base for the inverted head-and-shoulders (H&S) formation during the summer of 2024. The 55-day Simple Moving Average (SMA) at 101.94 reinforces this area as strong resistance. In case Dollar bulls push the DXY even higher, the 103.18 pivotal level comes into play.
If the downward pressure continues, a nosedive move could materialize towards the year-to-date low of 97.91 and the pivotal level of 97.73. Further below, a relatively thin technical support comes in at 96.94 before looking at the lower levels of this new price range. These would be at 95.25 and 94.56, meaning fresh lows not seen since 2022.
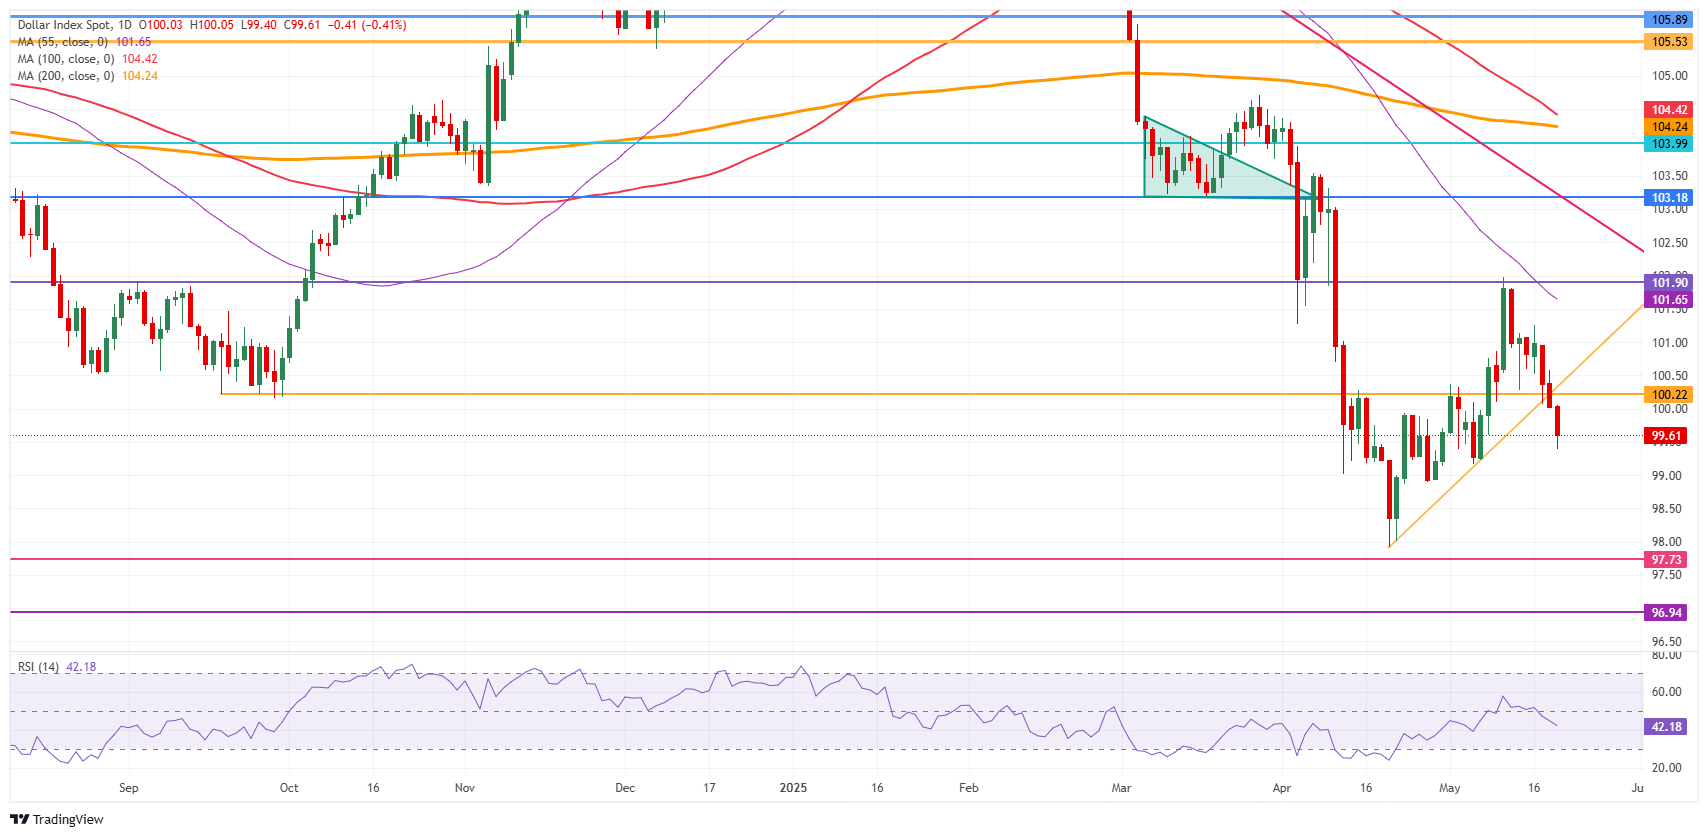
US Dollar Index: Daily Chart
Dot Plot FAQs
The “Dot Plot” is the popular name of the interest-rate projections by the Federal Open Market Committee (FOMC) of the US Federal Reserve (Fed), which implements monetary policy. These are published in the Summary of Economic Projections, a report in which FOMC members also release their individual projections on economic growth, the unemployment rate and inflation for the current year and the next few ones. The document consists of a chart plotting interest-rate projections, with each FOMC member’s forecast represented by a dot. The Fed also adds a table summarizing the range of forecasts and the median for each indicator. This makes it easier for market participants to see how policymakers expect the US economy to perform in the near, medium and long term.
The US Federal Reserve publishes the “Dot Plot” once every other meeting, or in four of the eight yearly scheduled meetings. The Summary of Economic Projections report is published along with the monetary policy decision.
The “Dot Plot” gives a comprehensive insight into the expectations from Federal Reserve (Fed) policymakers. As projections reflect each official’s projection for interest rates at the end of each year, it is considered a key forward-looking indicator. By looking at the “Dot Plot” and comparing the data to current interest-rate levels, market participants can see where policymakers expect rates to head to and the overall direction of monetary policy. As projections are released quarterly, the “Dot Plot” is widely used as a guide to figure out the terminal rate and the possible timing of a policy pivot.
The most market-moving data in the “Dot Plot” is the projection of the federal funds rate. Any change compared with previous projections is likely to influence the US Dollar (USD) valuation. Generally, if the “Dot Plot” shows that policymakers expect higher interest rates in the near term, this tends to be bullish for USD. Likewise, if projections point to lower rates ahead, the USD is likely to weaken.
 Copy Link
 Share on Facebook
 Share on X
 Share by Email