Australian Dollar struggles despite easing US-China tariff tensions, US CPI eyed
- The Australian Dollar declines despite easing trade tensions between the United States and China.
- US Commerce Secretary Lutnick said that both countries agreed on a framework to implement the Geneva Consensus.
- China’s Minister Li Chenggang noted that dialogue with the US has been rational and candid.
The Australian Dollar (AUD) declines against the US Dollar (USD) on Wednesday, retracing its recent gains. However, the AUD/USD pair may gain ground amid easing trade tensions between the United States (US) and China. Any economic change in China could impact AUD as China and Australia are close trade partners.
US Commerce Secretary Howard Lutnick indicated potential resolutions with China. On Tuesday, Lutnick noted that the US and China have reached a framework to implement the Geneva Consensus and are now seeking approval from US President Donald Trump, according to Bloomberg.
US negotiators also noted that they “absolutely expect” the issues around shipments of rare earth minerals and magnets will be resolved with the framework implementation. While China’s Vice Commerce Minister Li Chenggang said that communication with the United States has been rational and candid, he will report on a framework to Chinese leaders.
Australian Dollar edges lower despite easing US-China tariff tensions
- The US Dollar Index (DXY), which measures the value of the US Dollar against six major currencies, is extending its gains for the second successive day and trading higher at around 99.10 at the time of writing. The US Consumer Price Index (CPI) inflation will be closely watched on Wednesday, with expectations of a 2.5% year-over-year (YoY) rise in May.
- The US Court of Appeals for the Federal Circuit extended an earlier, temporary respite on Tuesday for the government as it presses a challenge to a lower court ruling last month that blocked the tariffs. The federal appeals court has ruled that President Trump’s broad tariffs can remain in effect while legal appeals continue, per Bloomberg.
- The US Bureau of Labor Statistics (BLS) reported that US Nonfarm Payrolls (NFP) rose by 139,000 in May compared to the 147,000 increase (revised from 177,000) in April. This reading came in above the market consensus of 130,000. Moreover, the Unemployment Rate held steady at 4.2%, and the Average Hourly Earnings remained unchanged at 3.9%, both readings came in stronger than the market expectation.
- US President Donald Trump called upon, in a post published on Truth Social on Wednesday, Federal Reserve (Fed) Chairman Jerome Powell to lower the policy rate. "ADP NUMBER OUT!!! “Too Late” Powell must now LOWER THE RATE. He is unbelievable!!! Europe has lowered NINE TIMES," Trump said.
- The National Bureau of Statistics of China reported that the Consumer Price Index (CPI) dropped at an annual pace of 0.1% in May, following April’s 0.1% decline. However, the market consensus was for a 0.2% decrease in the reported period. Meanwhile, China’s CPI inflation declined by 0.2% MoM, against April’s 0.1% increase. China’s Producer Price Index (PPI) continues to weaken with an annual decline of 3.3% in May, following a 2.7% decline in April.
- China's Trade Balance (CNY) arrived at CNY743.56 billion in May, expanding from the previous surplus of CNY689.99 billion. Meanwhile, Exports rose 6.3% YoY against 9.3% in April. The country’s imports fell 2.1% YoY in the same period, from a 0.8% rise recorded previously.
- Australia’s Trade Balance posted a 5,413M surplus month-over-month in April, below the 6,100M expected and 6,892M (revised from 6,900M) in the previous reading. Exports declined by 2.4% MoM in April, against a 7.2% rise prior (revised from 7.6%). Meanwhile, Imports rose by 1.1%, compared to a decline of 2.4% (revised from -2.2%) seen in March. China’s Caixin Services PMI rose to 51.1 in May as expected, from 50.7 in April.
Australian Dollar tests 0.6500 support near nine-day EMA
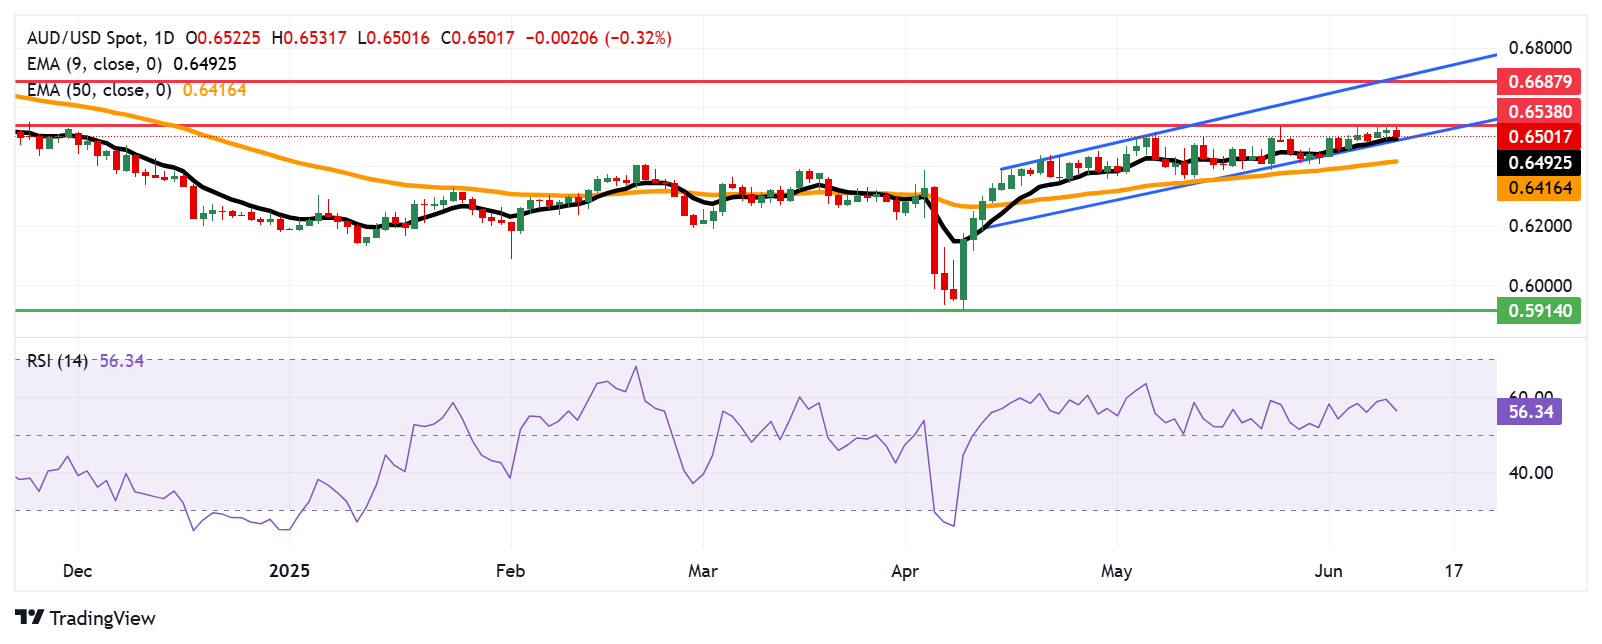
AUD/USD trading around 0.6510 on Wednesday. The daily chart’s technical analysis indicates a prevailing bullish bias as the pair remains within the ascending channel pattern. Moreover, the pair stays above the nine-day Exponential Moving Average (EMA), suggesting a stronger short-term price momentum. The 14-day Relative Strength Index (RSI) is also remaining above the 50 mark, indicating a bullish bias.
The AUD/USD pair may target an immediate barrier at a seven-month high of 0.6538, which was reached on June 5. Further advances could prompt the pair to explore the region around the eight-month high at 0.6687, aligned with the upper boundary of the ascending channel around 0.6710.
On the downside, the initial support appears at the nine-day EMA of 0.6492, aligned with the ascending channel’s lower boundary around 0.6480. A break below this crucial support zone could weaken the bullish bias and lead the AUD/USD pair to test the 50-day EMA at 0.6416.
AUD/USD: Daily Chart
Australian Dollar PRICE Today
The table below shows the percentage change of Australian Dollar (AUD) against listed major currencies today. Australian Dollar was the weakest against the US Dollar.
| USD | EUR | GBP | JPY | CAD | AUD | NZD | CHF | |
|---|---|---|---|---|---|---|---|---|
| USD | 0.09% | 0.14% | 0.20% | 0.05% | 0.13% | 0.39% | 0.07% | |
| EUR | -0.09% | 0.05% | 0.13% | -0.05% | 0.03% | 0.25% | -0.02% | |
| GBP | -0.14% | -0.05% | 0.06% | -0.07% | -0.00% | 0.21% | -0.08% | |
| JPY | -0.20% | -0.13% | -0.06% | -0.25% | -0.07% | 0.16% | -0.17% | |
| CAD | -0.05% | 0.05% | 0.07% | 0.25% | 0.10% | 0.30% | -0.01% | |
| AUD | -0.13% | -0.03% | 0.00% | 0.07% | -0.10% | 0.22% | -0.06% | |
| NZD | -0.39% | -0.25% | -0.21% | -0.16% | -0.30% | -0.22% | -0.29% | |
| CHF | -0.07% | 0.02% | 0.08% | 0.17% | 0.01% | 0.06% | 0.29% |
The heat map shows percentage changes of major currencies against each other. The base currency is picked from the left column, while the quote currency is picked from the top row. For example, if you pick the Australian Dollar from the left column and move along the horizontal line to the US Dollar, the percentage change displayed in the box will represent AUD (base)/USD (quote).
Economic Indicator
Consumer Price Index (MoM)
Inflationary or deflationary tendencies are measured by periodically summing the prices of a basket of representative goods and services and presenting the data as The Consumer Price Index (CPI). CPI data is compiled on a monthly basis and released by the US Department of Labor Statistics. The MoM figure compares the prices of goods in the reference month to the previous month.The CPI is a key indicator to measure inflation and changes in purchasing trends. Generally, a high reading is seen as bullish for the US Dollar (USD), while a low reading is seen as bearish.
Read more.Next release: Wed Jun 11, 2025 12:30
Frequency: Monthly
Consensus: 0.2%
Previous: 0.2%
Source: US Bureau of Labor Statistics
The US Federal Reserve (Fed) has a dual mandate of maintaining price stability and maximum employment. According to such mandate, inflation should be at around 2% YoY and has become the weakest pillar of the central bank’s directive ever since the world suffered a pandemic, which extends to these days. Price pressures keep rising amid supply-chain issues and bottlenecks, with the Consumer Price Index (CPI) hanging at multi-decade highs. The Fed has already taken measures to tame inflation and is expected to maintain an aggressive stance in the foreseeable future.
 Copy Link
 Share on Facebook
 Share on X
 Share by Email